
Abbreviations
Cmax
Maximum plasma concentration
Ctrough
Trough plasma concentration
ER Extended-release
GMFE Geometric mean fold error
IR Immediate-release
kcat
Transport rate constant
MATE Multidrug and toxin extrusion protein
MRD Mean relative deviation
NLME Non-linear mixed effects
OCT Organic cation transporter
PBPK Physiologically based pharmacokinetic
PMAT Plasma membrane monoamine transporter
RPF Renal plasma flow
Introduction
Metformin is recommended as first-line therapy for type 2 diabetes [1] and predominantly acts in the gastrointestinal system by decreasing glucose uptake from the lumen and increasing glucagon-like peptide-1 secretion [2]. Furthermore, it leads to inhibition of hepatic gluconeogenesis [3] and increased insulin-stimulated glucose uptake into other organs e.g. skeletal muscle [4], resulting in a reduction in blood glucose levels. Recent work suggests that metformin therapy is associated with a preventive effect against cancer and could even be a useful adjuvant in cancer therapy [5].
Metformin is highly soluble, exhibits a low permeability and retains a positive charge over the whole range of physiological pH. Hence, its absorption, distribution and excretion strongly depend on active transport processes to cross biological membranes. Incomplete transporter-mediated absorption from the upper intestine yields a moderate bioavailability of about 55% [6]. Pharmacokinetic metformin data indicate high inter- and intraindividual variation [6]. Metformin is not metabolised and is mainly excreted in urine passively via glomerular filtration and actively by consecutive action of organic cation transporter (OCT) 2 and multidrug and toxin extrusion proteins (MATEs) [6].
While the pharmacokinetics of metformin is generally well understood, the influence of time-of-day on metformin pharmacology, in particular, has not yet been described. Analysing plasma concentration–time profiles of a twice daily metformin administration from a study conducted with the intention of investigating bioequivalence of different metformin formulations [7] revealed similar mean AUC values during day and night. However, altered plasma curve shapes as well as sizeable time-of-day variations of trough plasma concentrations (Ctrough) and maximum plasma concentrations (Cmax) were found. Many body functions, like the GFR and other excretion processes as well as absorption and metabolic processes, underlie intraday variations, resulting in changes of drug exposure and, subsequently, in daily rhythms of efficacy or toxicity [8]. Thus, observed variability in metformin plasma concentrations might be explained by time-of-day dependent pharmacokinetics. To date, however, no dedicated analyses were available in published literature to assess time-dependent alteration of metformin pharmacology in humans.
In general, large interindividual differences in diurnal preference (also referred to as ‘chronotype’) have been observed, for example as preferred wake-up and sleep times [9]. Chronotherapy, i.e. taking daytime into account for drug administration, might have clinical benefits in various indications [10–12]. Considering the individual chronotype within the context of personalised precision chronotherapy may improve therapy outcomes, as proposed as a potential treatment option for cancer patients [13].
Here, we (1) investigated whether metformin pharmacokinetics in humans exhibits a significant intraindividual difference depending on time-of-day of administration; (2) quantified the magnitude of the effect using non-linear mixed effects (NLME) pharmacokinetic modelling on a large clinical dataset of individual metformin concentration measurements; (3) generated hypotheses regarding sources of such daily variation and tested the underlying mechanisms using a literature-informed physiologically based pharmacokinetic (PBPK) modelling approach; (4) partly explained interindividual variability based on the modeldetermined chronotype; and (5) simulated the daily rhythms of metformin concentrations in relevant tissues, which could support the assessment of clinical relevance in future work.
Methods
Clinical dataset Individual metformin measurements from five clinical studies were used. Metformin was administered as immediate- (IR) and extended-release (ER) formulations of 500–2000 mg once to three times daily in single and multiple day regimens. All studies have been approved by the local ethics committees and informed consent was obtained from all participants before study entry. Results from studies II–V have not previously been published. Detailed information on all studies, including number and demographics of participants, inclusion and exclusion criteria and exact dosing/ sampling schedules are provided in electronic supplementary material (ESM) Tables 1–5 and ESM Figs 1–5.
Statistical analysis Individual plasma measurements were analysed separately for differences between Ctrough values measured immediately before the next dose in the morning (‘Ctrough,morning’) and the evening (‘Ctrough,evening’) as well as Cmax values measured after the morning dose (‘Cmax,morning’) and the evening dose (‘Cmax,evening’). Details on statistical analysis are provided in ESM Section 1.2.
NLME pharmacokinetic modelling An empirical pharmacokinetic model of metformin was implemented in NONMEM (version 7.4.3, ICON Development Solutions, Ellicott City, MD, USA), informed by individual data using NLME techniques. The final model was built and evaluated in a three-step procedure by: (1) developing a structural model by checking one-, two- and three-compartment disposition models as well as zero-order, first-order and Michaelis–Menten absorption and elimination kinetics; (2) quantifying interindividual and residual variabilities based on the structural model by testing variability on each model parameter; and (3) investigating the effects of the covariates (e.g. sex, age, body weight, serum creatinine, administered dose, formulation, comedication and food intake) using a forward inclusion and backward elimination procedure with significance levels of 5% and 0.1%, respectively.
A function assuming sinusoidal oscillations with a 24 h period (Equation 1) was tested on respective model parameters to identify whether a daily rhythm of metformin absorption, distribution and/or excretion processes improves the description of metformin plasma and urine concentrations:
where t = time, AMP = amplitude and TDEL = shift in time. Values for amplitude and shift were optimised by fitting model simulations to observed metformin profiles.
Details on final model selection and evaluation are provid
Literature-informed mechanistic PBPK modelling The literature was extensively searched for physiological conditions linked to rhythmicity in absorption, distribution and excretion of metformin, including metformin-specific transporters. ed in ESM Section 1.3.
To elucidate the key variables with impact on metformin pharmacokinetics, a mechanistic whole-body PBPK modelling approach was applied, where organs are represented by compartments that are connected via blood flow. The change of drug concentration in these compartments over time is described by differential equations. Mechanistic implementation of transport processes at their respective sites of action allows simulation and prediction of drug concentrations in all relevant organs and body sites. A published whole-body PBPK model of metformin [14] developed via the Open Systems Pharmacology Suite (version 8.0, https://www. open-systems-pharmacology.org/) using metformin studies in healthy volunteers after intravenous and oral administration in fasted and fed state (single and multipledose, dosing range 0.001–2550 mg) was used as a basis for further investigation. The model includes active transport by plasma membrane monoamine transporter (PMAT), OCT1 as well as consecutive action of OCT2 and MATE1.
Time-of-day variation of pharmacokinetic-related processes and physiological conditions identified in the literature was tested with the PBPK model. By modulating relevant model parameter values over time with an oscillation function (Equation 1), the influence of each process on metformin pharmacokinetics was tested separately. Amplitude and acrophase (i.e. clock time of maximal activity) of the tested rhythmic processes were implemented as reported previously or optimised by fitting simulations to observed aggregated metformin plasma concentration–time profiles from study I. The impact of each tested process on metformin pharmacokinetics was evaluated visually and quantitatively by calculating mean relative deviations (MRDs) and geometric mean fold errors (GMFEs) (ESM Equations 1 and 2), to estimate the model accuracy for metformin concentration–time profiles as well as Ctrough and Cmax ratios. Details on model extension and performance evaluation are provided in ESM Section 1.4. Information about expression of relevant transport proteins is presented in ESM Table 6.
Results
Clinical dataset The dataset derived from five studies included data on 191 healthy adults (65% men, 18–50 years) with 7476 plasma and 316 urine levels of metformin. Of these, 21.4% of plasma and 100% of urine measurements were observed after administration of IR formulations. Pharmacokinetic profiles covering at least one dosing interval were available for all individuals, with additional Ctrough measurements for multiple-dose administration studies (studies I and II: 1000 mg twice daily, and study III: 850 mg three times daily) that allowed further investigations of intraday variation in pharmacokinetics.
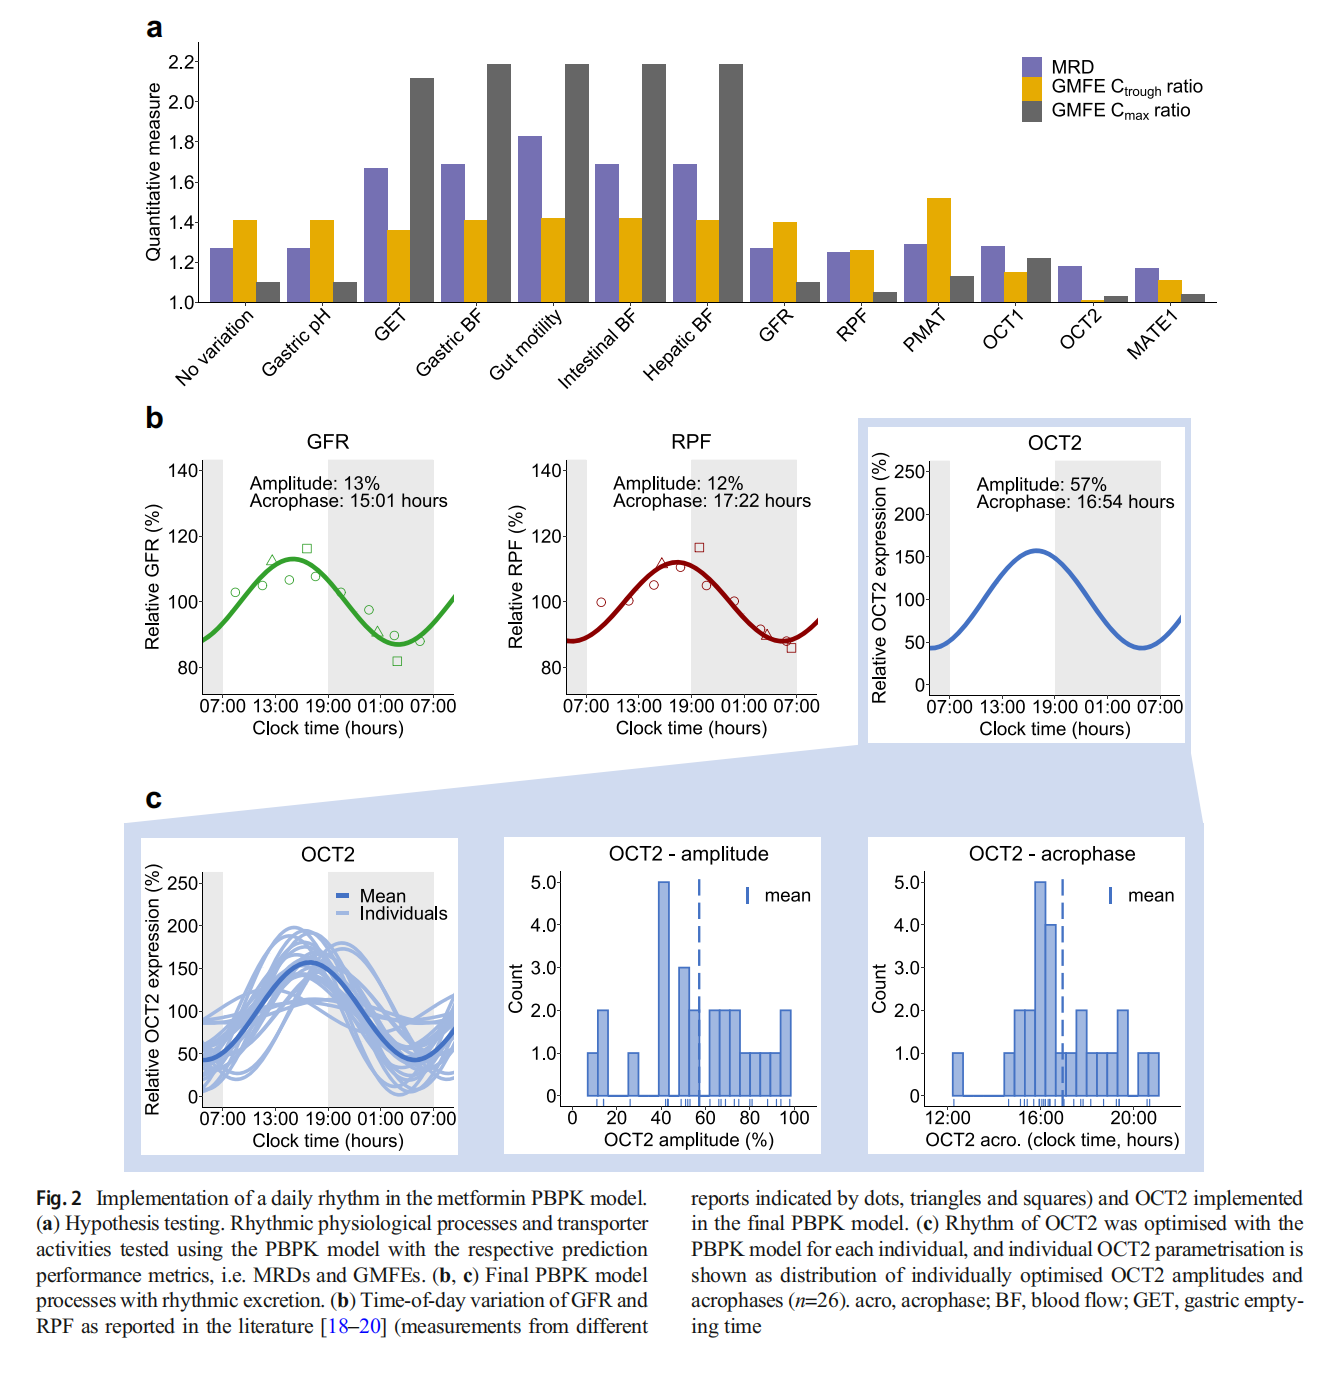
Statistical analysis Plasma concentration–time profiles from studies I and II were used for the investigation of differences in individual mean Ctrough,morning and Ctrough,evening values. Statistical analyses revealed 42% higher mean Ctrough measurements in the morning compared with the evening (p=0.00016). Moreover, individual Ctrough measurements exhibited a large intraindividual variability of up to 75%. Linear mixed model analysis that included all individual Ctrough measurements also confirmed significantly higher Ctrough measurements in the morning (p<0.0001).
Although differences were less pronounced for Cmax, i.e. 16% higher mean Cmax values in the morning compared with the evening, measurements were significantly different with p=0.0053 for t test analysis of mean values. Furthermore, for Cmax, large intraindividual variability was observed, with variability up to 52%. In the mixed model analysis, the findings from analysing the means could be confirmed with p=0.0063. A summary of the statistical analysis is shown in Fig. 1a and ESM Figs 6 and 7.
NLME pharmacokinetic modelling All individual plasma and urine measurements from studies I–V were used for model development and were best described by a two-compartment disposition model with first-order absorption, distribution and clearance. IR formulations were modelled via first-order absorption and ER formulations by a zero-order release preceded the first-order absorption. Interindividual variability could be identified for clearance, central volume of distribution and bioavailability. Implementation of food intake, formulation and dose as significant covariates reduced the interindividual variabilities for clearance, volume of distribution and bioavailability by 14%, 75% and 52%, respectively. Administration after food intake led to a 1.9-fold higher relative bioavailability and a 0.6-fold slower absorption rate constant, but a 5.1-fold increased release duration for the ER formulation. The bioavailability of the ER formulation was 1.1-fold higher compared with the IR formulation. The metformin dose was implemented as a covariate using an exponential function (ESM Equation 3), leading to a decreased relative bioavailability for higher administered doses of metformin.
Daily variation was tested for absorption, distribution as well as clearance parameters. Model performance significantly improved if a daily rhythm on metformin clearance was incorporated (p<1.0 × 10–100), applying an estimated amplitude of 21% and an acrophase at 17:43 hours. Parameter estimates of the model are provided in ESM Table 7, and the model structure is presented in ESM Fig. 8. The performance of the NLME model without and with daily rhythm is presented with plasma concentration–time profiles and goodness-offit plots in Fig. 1b and ESM Figs 9–13, indicating good performance of the model including daily variation, with 95% and 83% of predicted individual metformin plasma and urine concentrations, respectively, within twofold of the observed values.
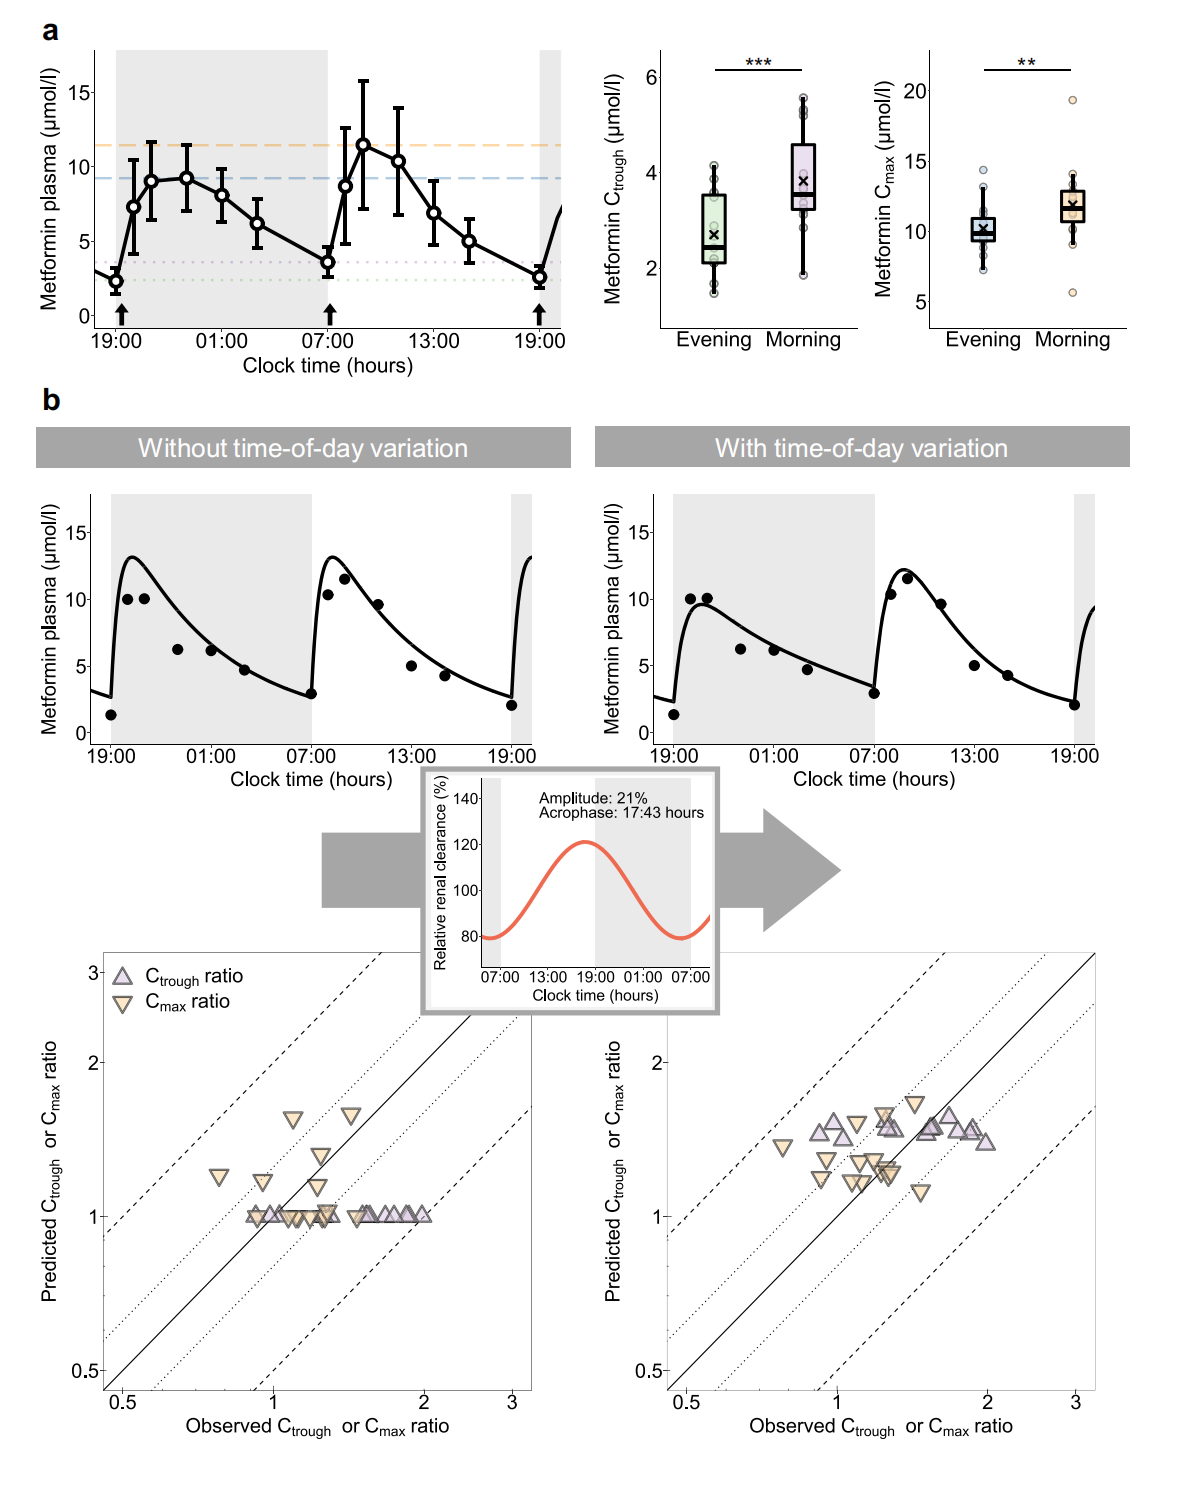
Ctrough and Cmax predictions showed smaller errors for the model with rhythmic renal clearance compared with the model assuming constant renal clearance, quantified by a decrease of mean GMFEs from 1.45 to 1.21 for Ctrough and 1.21 to 1.19 for Cmax ratios of study I (Fig. 1b and ESM Figs 14 and 15). Comparison of conditional weighted residuals vs time and predicted concentration is presented in ESM Figs 16 and 17. Further details on modelling results are provided in ESM Section 2.2.
Literature-informed mechanistic PBPK modelling Previous studies reported daily rhythm in absorption- and distributionrelated physiological conditions, namely gastric pH, gastric emptying time, gut motility, blood flow to the gastrointestinal tract and hepatic blood flow, with effects on drug solubility, bioavailability, transit time through the gastrointestinal tract and distribution in the body. For excretion-related processes, rhythmic GFR and renal blood flow have been described (ESM Table 8). In addition, daily variation of active transport processes in the liver and kidney have been observed [8]. No rhythm was reported for PMAT (SLC29A4), mainly involved in intestinal absorption of metformin, either in humans or in animals. For OCT1 (SLC22A1), the transporter mainly responsible for metformin uptake into hepatocytes, no human time-series data were available. However, in mice, hepatic Slc22a1 mRNA expression is not rhythmic [15]. Regarding renal transporters, Slc47a1 (MATE1) is not rhythmic [15, 16], while for Slc22a2 (OCT2) expression, one study reported significant daily rhythms [17]. Again, no human expression data were available to investigate SLC22A2 (OCT2) rhythmicity.
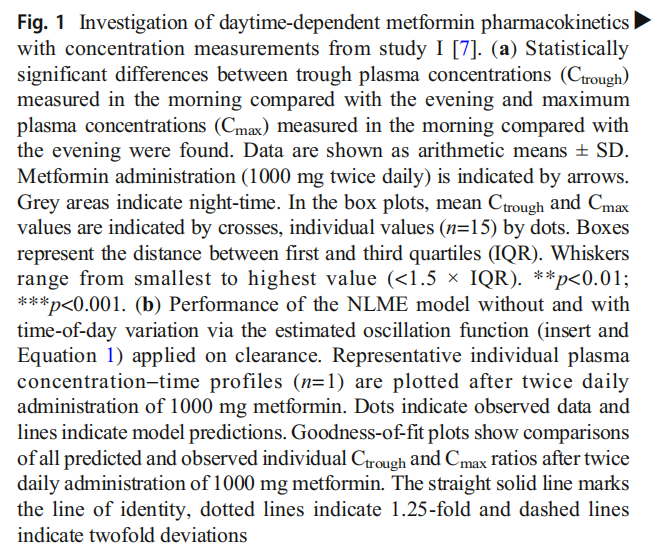
These potential factors introducing time-of-day variation were tested in the PBPK model to confirm and explain findings from the NLME model regarding observed time-of day variation in metformin pharmacokinetics. Temporal variations of gastrointestinal and distribution-related processes as well as GFR and renal plasma flow (RPF) were modelled with literature values for amplitudes and acrophases, expressing amplitudes from 12–56% (ESM Table 8). However, judging by GMFEs for Ctrough and Cmax ratios, rhythmic absorption-, distribution- and passive excretion-related processes on metformin pharmacokinetics did not lead to an improved description of metformin concentration–time profiles, especially not for both Ctrough and Cmax values compared with the base PBPK model without any temporal variation. The daily variation of transport rates was modelled with optimised values for amplitudes and acrophases. Introducing oscillation in PMAT and OCT1 activities resulted in insufficient descriptions of both metformin Ctrough and Cmax ratios, while time-of day variation in activity of excretion-related transporters, i.e. OCT2 and MATE1, improved descriptions of observed plasma concentrations as well as Ctrough and Cmax ratios (Fig. 2a and ESM Figs 18 and 19 under Section 2.3.2). In the final model, metformin plasma concentration–time profiles were modelled incorporating a combination of a daily rhythm in GFR, renal blood flow and OCT2 (Fig. 2b), which is consistent with published findings for human renal physiology [17–20]. PBPK model parameters are listed in ESM Tables 9 and 10 under Section 2.3.3.
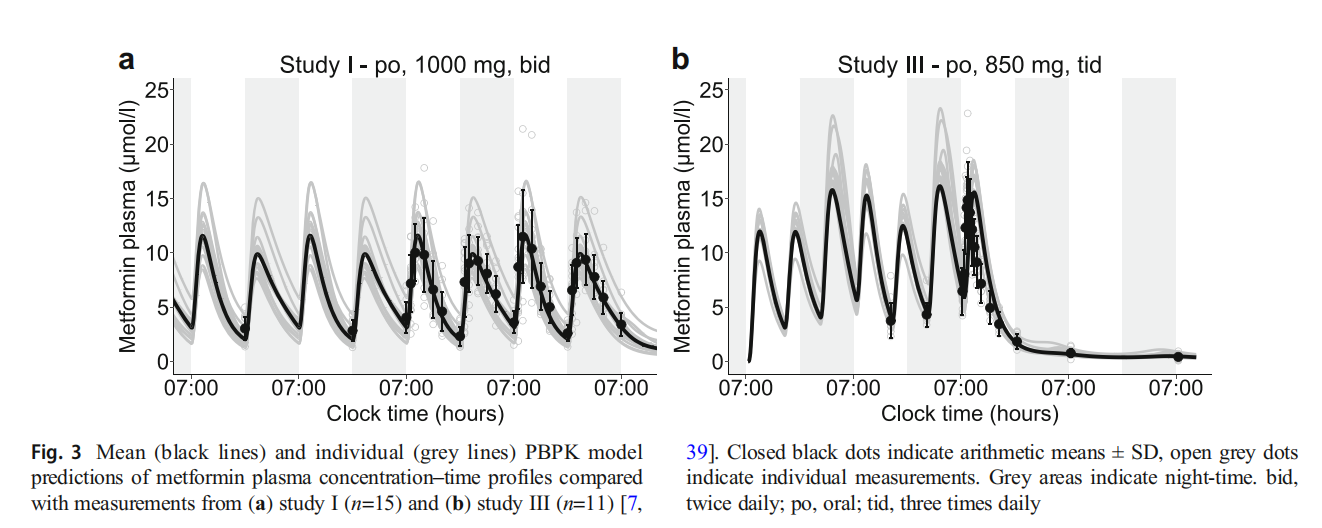
Individual differences in the daily rhythms of metformin pharmacokinetics Individual metformin profiles exhibited a large interindividual variability and were insufficiently described using the same rhythmic OCT2 parametrisation for all participants. To account for interindividual variability in OCT2 baseline activity (caused by e.g. genetic polymorphisms), transport rate constant (kcat) values were optimised for individual profiles with mean kcat=57680 1/min (CV=69%; n=26). Individual chronotypes were estimated by calculating OCT2 amplitudes and acrophases separately for each individual with a mean amplitude of 57% (CV=43%) and mean acrophase at 16:54 hours (CV=39%). The distribution of individual amplitudes and acrophases is shown in Fig. 2c, while no correlation of OCT2 parameters has been determined (ESM Fig. 20). Predicted mean and individual plasma concentration–time profiles from studies I and III are shown in Fig. 3, agreeing with observed higher Ctrough values before the morning dose and higher Cmax values after the morning dose when administered every 12 h (Fig. 3a). Highest Cmax values were predicted during the night for the three-times daily regimen (Fig. 3b). Predicted plasma concentration–time profiles for all studies compared with observed data are shown in ESM Figs 21–25. Goodness of-fit plots demonstrate that 93% of predicted plasma concentration values from studies I and III lie within twofold of observed values (ESM Fig. 26). Comparisons of predicted and observed Ctrough and Cmax ratios are shown in ESM Fig. 27.
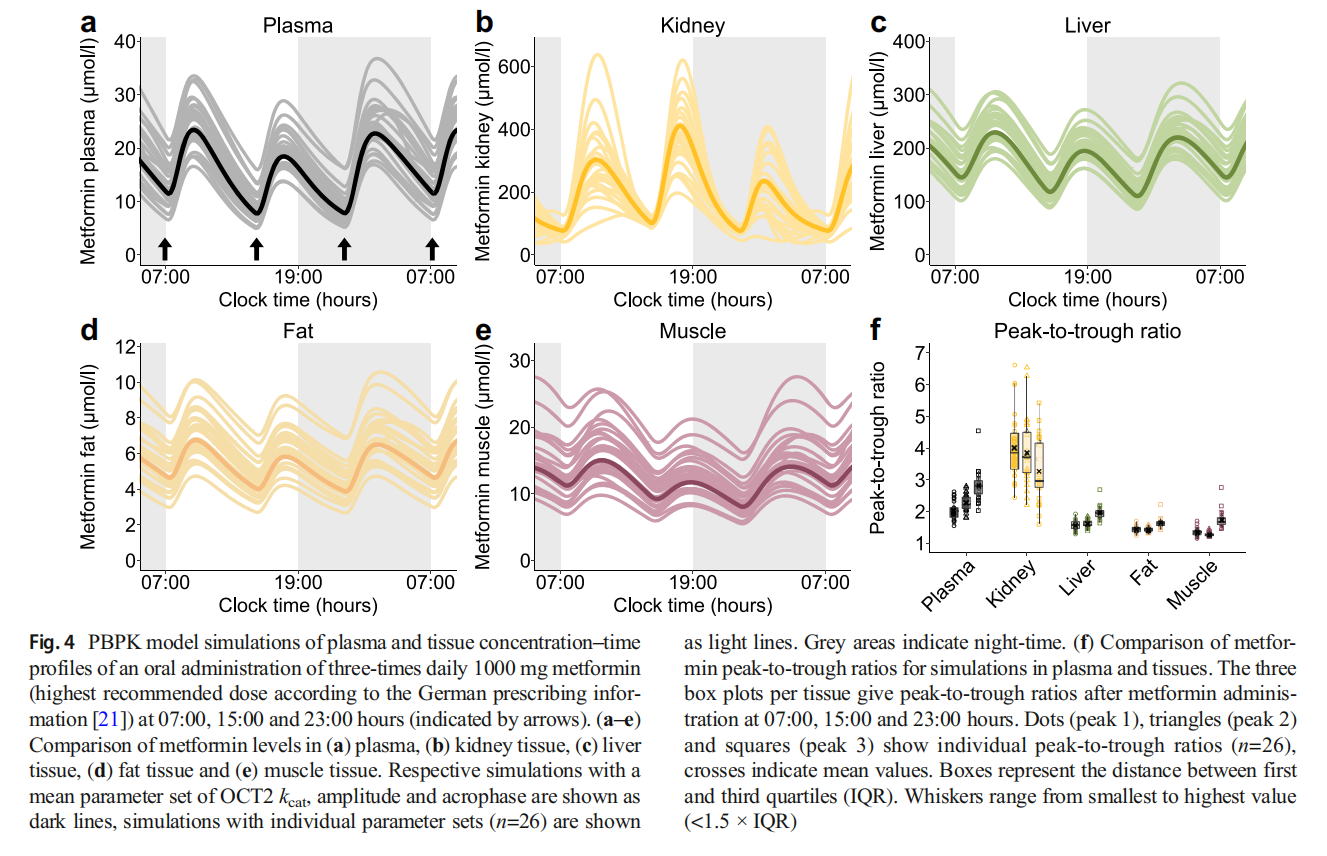
Simulations in relevant tissues To investigate the impact of daily modulation of metformin pharmacology on its exposure in tissues, plasma, kidney, liver, fat and muscle tissue concentrations were simulated in steady-state, administering the highest recommended metformin dose of 1000 mg three times daily [21]. Simulated metformin concentration–time profiles for plasma and tissues showed substantial interindividual and intraday variability (Fig. 4a–e) and calculations of metformin peak-to-trough concentration ratios for each dosing interval within 1 day in plasma and tissues revealed intraday, intertissue and interindividual differences (Fig. 4f). As OCT2, the main contributor to metformin rhythm in the model, is expressed at the basolateral membrane of tubular epithelial cells, concentrations in the kidney showed an opposing trend due to a decreased transport of metformin into kidney cells at night, leading to increased concentrations in plasma and other tissues.
Discussion
Chronotherapy might have a clinical benefit in various indications, discussed e.g. for therapy of cancer [10], rheumatoid arthritis [11] or metabolic diseases [12]. To date, the implications of chronopharmacology for treatment of type 2 diabetes have not been investigated in dedicated clinical trials. The presented work focused on statistical and in silico analyses of metformin pharmacokinetics covering interindividual variability with the help of NLME and PBPK modelling, revealing intraday changes in pharmacokinetics for metformin plasma and urine concentrations. Mechanistic mathematical modelling of metformin pharmacokinetics allowed the investigation of hypotheses for the underlying chrono-mechanisms and the integration of related findings in the overall context of diabetes therapy.
Statistical analyses showed significant differences between metformin Ctrough as well as Cmax values measured in the morning or the evening. To further investigate these differences and variations, empirical and mechanistic pharmacokinetic models were applied, as these methods have been proven useful to (1) test hypotheses and (2) investigate time-of-day dependence, e.g. for oral bioavailability and clearance of midazolam [22], light-triggered melatonin release [23] and heart rate [24].
The NLME pharmacokinetic modelling analysis led to an accurate description of metformin plasma concentrations, especially Ctrough and Cmax measurements, when a daily rhythm for systemic clearance was incorporated. In contrast, rhythms of other processes, e.g. the absorption, did not improve the modelling outcomes. The time-dependent effect on systemic clearance might be predominantly attributed to biologic rhythmic variations of kidney function, as metformin is exclusively eliminated renally. Rhythmic GFR and renal blood flow have been described [18–20] while the variation in GFR cannot be explained by the oscillation of renal blood flow alone [20]. In mice, the circadian clock in podocytes has been found to contribute to a rhythmic GFR [25], but the influence of further systemic factors are not completely understood [26]. However, the NLME estimated amplitude for the oscillation of metformin clearance was more pronounced compared with the published amplitude for GFR (21% vs 13%) [18–20], leading to the hypothesis of an additional daily rhythm in active secretion.
The PBPK modelling approach complemented the empirical NLME model, as it allowed the mechanistic implementation of individual physiology including demographics, kidney function as well as relevant transport proteins. Key processes from the NLME model were well in line with the independently developed PBPK model, and the additional rhythmic active secretion, proposed by analysing the NLME model outcomes, could be supported with the PBPK approach. Here, metformin plasma concentration–time profiles, especially Cmax as well as Ctrough, were best described assuming a combination of rhythmic GFR, renal blood flow and tubular secretion rate. In the literature, there is no unambiguous evidence for rhythmic SLC22A2 compared with SLC47A1 (MATE1). Kidney expression data from mice presented by Zhang et al [16] reveal that Slc47a1 is not rhythmic, similar to Slc22a2, but a slightly more pronounced rhythm in Slc22a2 is shown. Oda et al [17] observed rhythmic Slc22a2 but not Slc47a1 expression profiles in nocturnal mice [17]. Baboons exhibit a rhythm in both SLC22A2 and SLC47A1 expression in the kidney medulla, but not in the kidney cortex, where the relevant proximate tubule cells are located [27]. Unfortunately, expression data of SLC22A2 in human kidney cells are currently not available. However, due to the sequential action of OCT2 and MATEs in tubule cells, discrimination between both processes is challenging and dedicated studies are required to investigate the specific contributions of both OCT2 and MATEs. Model implementation of daily variation for both OCT2 and MATE1, also taking interindividual variability into account, was not feasible using the currently available data. If data from human kidneys become available, the model could be adjusted in future projects.
The influence of other possible rhythmic processes affecting drug pharmacokinetics, i.e. absorption- and distributionrelated mechanisms, was quantified with a PBPK model, because these mechanisms might also affect metformin solubility, distribution and transit time through the gastrointestinal tract, bioavailability and tissue distribution [8]. Food intake has been reported to reduce metformin bioavailability of an IR formulation [28] but was not the main contributor to observed daily variations of metformin pharmacokinetics according to our PBPK model analysis. Only a minor contribution of daily rhythms in other absorption- and distributionrelated processes has been assumed in previous work [15,28–30]. This was confirmed, as a rhythmic absorption rate reduced NLME model performance, and PBPK modelling of rhythmic absorption- and distribution-related processes showed only a very small effect on plasma concentration– time profiles (ESM Figs 18 and 19). An altered metformin absorption, however, might have a more pronounced impact on its pharmacokinetics after administration of ER formulations, which was not addressed in this study due to the lack of clinical data.
Both the NLME and the PBPK models predict higher Ctrough and Cmax values of the morning dose compared with the evening dose after twice daily administration. The PBPK model predicts higher Cmax values during the night when metformin is administered in a three-times daily regimen. This observation is expected, as maximum GFR, RPF and OCT2 activity are modelled in the late afternoon and minimum activity was assumed in the early morning. Hence, in comparison with the morning dose, higher metformin levels are expected after the night dose administered at 23:30 hours with increased Ctrough values predicted in the morning due to lower elimination of metformin. Moreover, individual differences in night Cmax compared with day Cmax can be attributed to individual chronotypes estimated by the model. For the three-times daily regimen, frequent measurements during the night would be valuable to verify model hypotheses.
Since large interindividual differences in individual chronotypes have been observed [9], ‘chronotype’ like phase differences were hypothesised and an individual OCT2 parametrisation improved plasma concentration–time predictions. Whereas all data herein are from healthy volunteers, an extension to patients with diabetes or kidney failure might be challenging due to relevant pathophysiological changes. Moreover, rhythms in GFR, RPF and OCT2 could be different in patients compared with healthy individuals [31] and, thus, require further experimental data to adjust our model.
Both of our presented models assume active renal excretion as the main contributor to metformin pharmacokinetics. In our NLME model, a large interindividual variability (CV=68%) was estimated on the clearance processes. Other modelling work, e.g. by Stage and coworkers, identified less variability on the clearance (CV=25%) but found large interoccasion variability (up to CV=94%) on absorption and bioavailability processes [32]. Duong et al presented varying degrees of interindividual variability without modelling daytime variations but incorporated interoccasion variability as a random error term [33]. The comparison of parameter estimates from empirical NLME models is complex, as the models are nonmechanistic and were built for different purposes with different model structures and different datasets. It may be speculated that the modelled interoccasion variability might represent parts of the daytime variation, as the inclusion of daytime variation in our model reduced the interindividual variability on the central volume of distribution and the clearance significantly, by 36% and 11%, respectively.
Disruption of the circadian clock has been associated with the development of various diseases, such as metabolic and cardiovascular disorders [34]. Mistimed sleep, for example in shift workers, has been identified as a risk factor for developing type 2 diabetes [35], as this affects glucose tolerance and insulin sensitivity [36]. Additionally, a disrupted daily rhythm has been described in diabetes patients [37]. In diet-induced obese rats, targeting the disrupted clock using melatonin in combination with metformin led to an improved therapy outcome [38]. However, using chronobiological concepts to optimise the treatment of type 2 diabetes is not adopted in clinical practice yet. In mice, differences in the direct glucose-lowering effect of metformin and in blood lactic acid levels were observed if metformin was administered in the active or the rest phase of the animals [15], which would support the hypothesis of time-of-day dependent pharmacodynamics. An interesting future research question regarding clinical implication might focus on the extent to which intraday variation of metformin pharmacokinetics affects efficacy and toxicity in humans, i.e. the risk of lactic acidosis, which needs further investigation. Additionally, personalised chronotherapy might improve therapy outcomes for diabetes patients.
Statistical analyses as well as empirical and mechanistic pharmacokinetic modelling were successfully applied to generate and test hypotheses of the underlying chronomechanisms affecting metformin pharmacokinetics. Both modelling approaches suggest that rhythmic renal elimination had the strongest impact on metformin pharmacokinetics. Key variables of renal elimination were the rhythms in GFR, renal blood flow and OCT2-dependent transport rate. More broadly, our analyses demonstrated the strength of combining empirical and mechanistic pharmacokinetic modelling as a powerful toolchain to investigate scenarios with incomplete and missing clinical data. Furthermore, our results suggest a significant impact of chronotype on metformin pharmacology. Thus, this work might be a starting point for the translation of study results to therapy outcomes and risk assessment by individualised chronotherapy.
Supplementary Information The online version contains peer-reviewed but unedited supplementary material available at https://doi.org/10.1007/ s00125-023-05898-4.
Acknowledgements We thank Bristol Myers Squibb and Boehringer Ingelheim for provision of individual pharmacokinetic data.
Data availability The datasets analysed during the current study from Bristol Myers Squibb (study I) and Boehringer Ingelheim (studies II—V) are not publicly available. Data from Bristol Myers Squibb are however available from the authors upon reasonable request and with the permission of Bristol Myers Squibb. Regarding the data from Boehringer Ingelheim, interested researchers are invited to consult the external research platform Vivli (https://vivli.org/) to request access to anonymised data.
Funding Open Access funding enabled and organized by Projekt DEAL. MS was supported in part by the Robert Bosch Stiftung, Stuttgart, Germany, and the Deutsche Forschungsgemeinschaft (DFG, German Research Foundation) under Germany’s Excellence Strategy - EXC 2180 – 390900677. TL received funding from Boehringer Ingelheim Pharma GmbH & Co. KG for personnel costs of NS, CD and NH.
Authors‘ relationships and activities NH is now an employee of Boehringer Ingelheim Pharma GmbH & Co. KG. VN is an employee of Boehringer Ingelheim Pharma GmbH & Co. KG. DT, NS, DS, CD, RD, MS, PT and TL declare that there are no relationships or activities that might bias, or be perceived to bias, their work.
Contribution statement DT, NS and TL contributed to conception and design. PT and VN procured individual metformin data. DT, NS and TL analysed the data. DT, NS, DS and TL wrote the manuscript. All the authors contributed to interpretation of the results, critically revised the article and gave final approval of the version to be published. TL is the guarantor of this work.
Open Access This article is licensed under a Creative Commons Attribution 4.0 International License, which permits use, sharing, adaptation, distribution and reproduction in any medium or format, as long as you give appropriate credit to the original author(s) and the source, provide a link to the Creative Commons licence, and indicate if changes were made. The images or other third party material in this article are included in the article's Creative Commons licence, unless indicated otherwise in a credit line to the material. If material is not included in the article's Creative Commons licence and your intended use is not permitted by statutory regulation or exceeds the permitted use, you will need to obtain permission directly from the copyright holder. To view a copy of this licence, visit http://creativecommons.org/licenses/by/4.0/.
References
1. American Diabetes Association (2020) 9. Pharmacologic approaches to glycemic treatment: Standards of medical care in diabetes—2020. Diabetes Care 43(Supplement 1):S98–S110. https://doi.org/10.2337/dc20-S009
2. McCreight LJ, Bailey CJ, Pearson ER (2016) Metformin and the gastrointestinal tract. Diabetologia 59(3):426–435. https://doi.org/ 10.1007/s00125-015-3844-9
3. Rena G, Hardie DG, Pearson ER (2017) The mechanisms of action of metformin. Diabetologia 60(9):1577–1585. https://doi.org/10. 1007/s00125-017-4342-z
4. Galuska D, Nolte LA, Zierath JR, Wallberg-Henriksson H (1994) Effect of metformin on insulin-stimulated glucose transport in isolated skeletal muscle obtained from patients with NIDDM. Diabetologia 37(8):826–832. https://doi.org/10.1007/BF00404340
5. Coyle C, Cafferty FH, Vale C, Langley RE (2016) Metformin as an adjuvant treatment for cancer: a systematic review and metaanalysis. Ann Oncol 27(12):2184–2195. https://doi.org/10.1093/ annonc/mdw410
6. Graham GG, Punt J, Arora M et al (2011) Clinical pharmacokinetics of metformin. Clin Pharmacokinet 50(2):81–98. https://doi.org/ 10.2165/11534750-000000000-00000
7. Timmins P, Donahue S, Meeker J, Marathe P (2005) Steady-state pharmacokinetics of a novel extended-release metformin formulation. Clin Pharmacokinet 44(7):721–729. https://doi.org/10.2165/ 00003088-200544070-00004
8. Dallmann R, Brown SA, Gachon F (2014) Chronopharmacology: new insights and therapeutic implications. Annu Rev Pharmacol Toxicol 54(1):339–361. https://doi.org/10.1146/annurevpharmtox-011613-135923
9. Roenneberg T, Kuehnle T, Juda M et al (2007) Epidemiology of the human circadian clock. Sleep Med Rev 11(6):429–438. https://doi. org/10.1016/j.smrv.2007.07.005
10. Sancar A, Van Gelder RN (2021) Clocks, cancer, and chronochemotherapy. Science 371(6524):eabb0738. https://doi. org/10.1126/science.abb0738
11. Buttgereit F, Smolen JS, Coogan AN, Cajochen C (2015) Clocking in: chronobiology in rheumatoid arthritis. Nat Rev Rheumatol 11(6):349–356. https://doi.org/10.1038/nrrheum.2015.31
12. Wallace A, Chinn D, Rubin G (2003) Taking simvastatin in the morning compared with in the evening: randomised controlled trial. BMJ 327(7418):788. https://doi.org/10.1136/bmj.327.7418.788
13. Zhou J, Wang J, Zhang X, Tang Q (2021) New insights into cancer chronotherapies. Front Pharmacol 12(December):741295. https:// doi.org/10.3389/fphar.2021.741295
14. Hanke N, Türk D, Selzer D et al (2020) A comprehensive wholebody physiologically based pharmacokinetic drug–drug–gene interaction model of metformin and cimetidine in healthy adults and renally impaired individuals. Clin Pharmacokinet 59(11): 1419–1431. https://doi.org/10.1007/s40262-020-00896-w
15. Henriksson E, Huber A-L, Soto EK et al (2017) The liver circadian clock modulates biochemical and physiological responses to metformin. J Biol Rhythms 32(4):345–358. https://doi.org/10. 1177/0748730417710348
16. Zhang R, Lahens NF, Ballance HI, Hughes ME, Hogenesch JB (2014) A circadian gene expression atlas in mammals: implications for biology and medicine. Proc Natl Acad Sci U S A 111(45): 16219–16224. https://doi.org/10.1073/pnas.1408886111
17. Oda M, Koyanagi S, Tsurudome Y, Kanemitsu T, Matsunaga N, Ohdo S (2014) Renal circadian clock regulates the dosing-time dependency of cisplatin-induced nephrotoxicity in mice. Mol Pharmacol 85(5):715–722. https://doi.org/10.1124/mol.113. 089805
18. Wesson LG (1964) Electrolyte excretion in relation to diurnal cycles of renal function. Medicine (Baltimore) 43(5):547–592. https://doi.org/10.1097/00005792-196409000-00002
19. van Acker BAC, Koomen GCM, Koopman MG, Krediet RT, Arisz L (1992) Discrepancy between circadian rhythms of inulin and creatinine clearance. J Lab Clin Med 120(3):400–410
20. Koopman MG, Koomen GCM, Krediet RT, de Moor EA, Hoek FJ, Arisz L (1989) Circadian rhythm of glomerular filtration rate in normal individuals. Clin Sci 77(1):105–111. https://doi.org/10. 1042/cs0770105
21. Merck (2022) Glucophage® 500 mg/- 850 mg/- 1000 mg Filmtabletten. Fachinformation. https://www.fachinfo.de/pdf/ 000959. Accessed 30 May 2022
22. van Rongen A, Kervezee L, Brill M et al (2015) Population pharmacokinetic model characterizing 24-hour variation in the pharmacokinetics of oral and intravenous midazolam in healthy volunteers. CPT Pharmacometrics Syst Pharmacol 4(8):454–464. https://doi. org/10.1002/psp4.12007
23. Peng HT, Bouak F, Vartanian O, Cheung B (2013) A physiologically based pharmacokinetics model for melatonin - effects of light and routes of administration. Int J Pharm 458(1):156–168. https:// doi.org/10.1016/j.ijpharm.2013.09.033
24. Lott D, Lehr T, Dingemanse J, Krause A (2018) Modeling tolerance development for the effect on heart rate of the selective S1P 1 receptor modulator ponesimod. Clin Pharmacol Ther 103(6): 1083–1092. https://doi.org/10.1002/cpt.877
25. Ansermet C, Centeno G, Nikolaeva S, Maillard MP, Pradervand S, Firsov D (2019) The intrinsic circadian clock in podocytes controls glomerular filtration rate. Sci Rep 9(1):1–9. https://doi.org/10.1038/ s41598-019-52682-9
26. Wuerzner G, Firsov D, Bonny O (2014) Circadian glomerular function: from physiology to molecular and therapeutical aspects. Nephrol Dial Transplant 29(8):1475–1480. https://doi.org/10. 1093/ndt/gft525
27. Mure LS, Le HD, Benegiamo G et al (2018) Diurnal transcriptome atlas of a primate across major neural and peripheral tissues. Science 359(6381):eaao0318. https://doi.org/10.1126/science. aao0318
28. Sambol NC, Brookes LG, Chiang J et al (1996) Food intake and dosage level, but not tablet vs solution dosage form, affect the absorption of metformin HCl in man. Br J Clin Pharmacol 42(4): 510–512. https://doi.org/10.1111/j.1365-2125.1996.tb00017.x
29. Desai D, Wong B, Huang Y et al (2014) Surfactant-mediated dissolution of metformin hydrochloride tablets: wetting effects versusion pairs diffusivity. J Pharm Sci 103(3):920–926. https://doi.org/10.1002/jps.23852
30. Vidon N, Chaussade S, Noel M, Franchisseur C, Huchet B, Bernier JJ (1988) Metformin in the digestive tract. Diabetes Res Clin Pract 4(3):223–229. https://doi.org/10.1016/s0168-8227(88)80022-6
31. Mohandas R, Douma LG, Scindia Y, Gumz ML (2022) Circadian rhythms and renal pathophysiology. J Clin Invest 132(3):e148277. https://doi.org/10.1172/JCI148277
32. Stage TB, Wellhagen G, Christensen MMH, Guiastrennec B, Brøsen K, Kjellsson MC (2019) Using a semi-mechanistic model to identify the main sources of variability of metformin pharmacokinetics. Basic Clin Pharmacol Toxicol 124(1):105–114. https:// doi.org/10.1111/bcpt.13139
33. Duong JK, Kumar SS, Kirkpatrick CM et al (2013) Population pharmacokinetics of metformin in healthy subjects and patients with type 2 diabetes mellitus: simulation of doses according to renal function. Clin Pharmacokinet 52(5):373–384. https://doi.org/10. 1007/s40262-013-0046-9
34. Kervezee L, Kosmadopoulos A, Boivin DB (2020) Metabolic and cardiovascular consequences of shift work: the role of circadian disruption and sleep disturbances. Eur J Neurosci 51(1):396–412. https://doi.org/10.1111/ejn.14216
35. Vetter C, Devore EE, Ramin CA, Speizer FE, Willett WC, Schernhammer ES (2015) Mismatch of sleep and work timing and risk of type 2 diabetes. Diabetes Care 38(9):1707–1713. https://doi.org/10.2337/dc15-0302
36. Mason IC, Qian J, Adler GK, Scheer FAJL (2020) Impact of circadian disruption on glucose metabolism: implications for type 2 diabetes. Diabetologia 63(3):462–472. https://doi.org/10.1007/ s00125-019-05059-6
37. Peng X, Fan R, Xie L et al (2022) A growing link between circadian rhythms, type 2 diabetes mellitus and alzheimer’s disease. Int J Mol Sci 23(1):504. https://doi.org/10.3390/ijms23010504
38. Thomas AP, Hoang J, Vongbunyong K, Nguyen A, Rakshit K, Matveyenko AV (2016) Administration of melatonin and metformin prevents deleterious effects of circadian disruption and obesity in male rats. Endocrinology 157(12):4720–4731. https://doi.org/10. 1210/en.2016-1309
39. Boehringer Ingelheim Pharma GmbH & Co. KG (2014) Bioavailability of BI 1356 BS and metformin after coadministration compared to the bioavailability of BI 1356 BS alone and metformin alone in healthy male volunteers. ClinicalTrials.gov Identifier: NCT02183506. National Library of Medicine, Bethesda MD; https://clinicaltrials.gov/ct2/show/NCT02183506. Accessed 13 Sep 2022
Publisher’s note Springer Nature remains neutral with regard to jurisdictional claims in published maps and institutional affiliations.
This article is excerpted from the Diabetologia by Wound World.