Molecular Markers in Patients with Chronic Wounds to Guide Surgical Debridement
Harold Brem,1,* Olivera Stojadinovic,2,* Robert F Diegelmann,3 Hyacinth Entero,1,4 Brian Lee,5 Irena Pastar,2Michael Golinko,1 Harvey Rosenberg,1 and Marjana Tomic-Canic2
Author information Article notes Copyright and License information Disclaimer
This article has been cited by other articles in PMC.
Abstract
Chronic wounds, such as venous ulcers, are characterized by physiological impairments manifested by delays in healing, resulting in severe morbidity. Surgical debridement is routinely performed on chronic wounds because it stimulates healing. However, procedures are repeated many times on the same patient because, in contrast to tumor excision, there are no objective biological/molecular markers to guide the extent of debridement. To develop bioassays that can potentially guide surgical debridement, we assessed the pathogenesis of the patients’ wound tissue before and after wound debridement. We obtained biopsies from three patients at two locations, the nonhealing edge (prior to debridement) and the adjacent, nonulcerated skin of the venous ulcers (post debridement), and evaluated their histology, biological response to wounding (migration) and gene expression profile. We found that biopsies from the nonhealing edges exhibit distinct pathogenic morphology (hyperproliferative/hyperkeratotic epidermis; dermal fibrosis; increased procollagen synthesis). Fibroblasts deriving from this location exhibit impaired migration in comparison to the cells from adjacent nonulcerated biopsies, which exhibit normalization of morphology and normal migration capacity. The nonhealing edges have a specific, identifiable, and reproducible gene expression profile. The adjacent nonulcerated biopsies have their own distinctive reproducible gene expression profile, signifying that particular wound areas can be identified by gene expression profiling. We conclude that chronic ulcers contain distinct subpopulations of cells with different capacity to heal and that gene expression profiling can be utilized to identify them. In the future, molecular markers will be developed to identify the nonimpaired tissue, thereby making surgical debridement more accurate and more efficacious.
INTRODUCTION
Chronic wounds, such as venous ulcers, are reaching epidemic proportions, affecting mostly elderly or disabled persons (1). The most common etiology of these ulcers is secondary to deep vein thrombosis or a dysfunctional valve (2). These ulcers significantly impair an eminence of life and increase healthcare expenditures for millions of people around the world. Over $25 billion is spent yearly in the United States alone on treatment of chronic wounds (3). Surgical debridement is the mainstay of treatments of chronic wounds (4,5) and is done in part to stimulate healing.
Chronic wounds are rapidly increasing among an elderly population with dysfunctional valves in their lower extremity deep veins, as well as among an increasing number of people with diabetes, neuropathic foot ulcers, and pressure ulcers (1). We encounter limitations in early treatment, deriving from the lack of knowledge of wound-healing mechanisms at the molecular level.
Successful treatment that stimulates healing is an essential step toward eliminating morbidity, improving quality of life for patients, and decreasing healthcare costs. Although scientists and clinicians are developing novel therapeutic approaches to promote healing, there is only one therapy that successfully underwent randomized controlled trials and is currently approved and available by the U.S. Food and Drug Administration for efficacy of treatment of venous ulcers: bi-layered cellular therapy (keratinocytes and fibroblasts) termed Human Skin Equivalent (6–8). A critical step in development and testing new therapeutic modalities is the ability to identify and target responsive/permissive cells within the wound that would properly respond to wound-healing stimuli.
Accumulation of devitalized tissue, decreased angiogenesis, increased proteases, hyperkeratotic tissue (9), cellular exudate, and infection at the outer surface of the wound are characteristics of chronic wounds, which prevent adequate cellular response to wound-healing stimuli. It has been recognized that wound bed preparation facilitates ordered restoration and regeneration of damaged tissue and provides enhanced function of new therapies (10). Debridement is a method of removing devitalized tissue from chronic wounds and a way to decrease bacterial contamination while enabling the stimulation of contraction and epithelialization (11). Nevertheless, surgical teaching remains relatively primitive in that new surgeons are classically taught to debride until it bleeds. Typically, patients are debrided as often as weekly and never heal, at great expense and morbidity. The question remains: can objective determination of the borders of surgical debridement be obtained? We hypothesize that an assay can be developed to guide margins of surgical debridement that will further assure therapeutic applications on responsive cells.
Microarrays may offer one solution. This technology brings the ability to simultaneously analyze the expression patterns of the entire genome, thus allowing identification of pathogenic transcriptional profiles. Gene expression profiling of various human tumors lead to the identification of transcriptional signatures related to tumor classification, disease outcome, or response to therapy (12–16). This technology is also used to study the mechanism of action of specific therapeutics—pharmacogenomics (17). Previous studies have identified genetic profile of repair of different tissues, such as cornea, tendons, bone, and skin (18–20). We have shown previously that activation of β-catenin pathway leads to induction of the oncogene c-myc and contributes to chronic wound development through inhibition of epithelialization (9). However, the identification of expression profiles that lead to pathogenesis of chronic ulcers remains to be elucidated.
In this report, we utilized expression profiling of patients’ biopsies from specific chronic wound locations, nonhealing edges and adjacent, nonulcerated skin obtained during surgical debridement, to identify viable tissue within a wound that has greater potential to respond to healing stimuli. We found that each of the two locations exhibit a specific transcriptional signature profile that correlates to cellular response to wounding. Taken together, our data identified two distinct cellular populations within the chronic wound with different capacity to heal, thus providing the potential to identify molecular markers of chronic wounds that may guide debridement. Lastly, our data introduce gene expression profiling as a useful tool to identify the debridement margin and specific cells that are responsive to wound-healing stimuli.
MATERIALS AND METHODS
Skin Specimens, Histology, and Immunohistochemistry
Chronic wound skin biopsies were obtained from discarded tissue after debridement procedures on three patients who gave consent with venous reflux ulcers (approved protocol 01-0960[001] 03sux). A small portion of the specimens were fixed in formalin and processed for paraffin or embedded in OCT compound (Tissue Tek), whereas majority of the samples were stored in RNAlater (Ambion) for the subsequent RNA isolation. Normal skin specimens were obtained as discarded tissue from voluntary surgery (approved protocol 25121). Paraffin embedded tissue was sectioned and 5 μm thick sections were stained with hematoxylin and eosin. Sections were also stained with pro-collagen type I antibody M-38 (Developmental Studies Hybridoma Bank at the University of Iowa) (21) following previously published protocol (9).
Five micrometer thick frozen skin sections were cut with a cryostat (Jung Frigocut 28006; Leica) and stored at –80°C. Slides containing frozen sections were fixed in a cold acetone and blocked with 3% BSA diluted in 1×PBS for 30 min. The EGFR primary antibody (Santa Cruz) was used in dilution 1:200 for overnight incubation at 4°C. Signal was visualized using secondary FITC anti-rabbit antibody 1:500 (Molecular Probes).
All sections were analyzed using a Carl Zeiss microscope (Carl Zeiss, Thornwood, NY) and digital images were collected using Adobe TWAIN_32 program.
Total RNA Isolation and Microarray Analyses
Total RNA was isolated using RNeasy (QIAGEN) following commercial protocol, as previously described (22). Five micrograms of total RNA was reversed-transcribed, amplified, and labeled according to the protocol. Labeled cRNA was hybridized to HG-U133A arrays (Affymetrix), and arrays were washed and stained with anti-biotin streptavidin-phycoerythin labeled antibody using Affymetrix fluidics station and then scanned using the Agilent GeneArray Scanner system (Hewlett-Packard). Microarray Suite 5.0 (Affymetrix) was used for data extraction and for further analysis, data mining tool 3.0 (Affymetrix), and GeneSpring™ software 7.2 (Silicon Genetics) was used for normalization, fold change calculations, and clustering. Differential expressions of transcripts were determined by calculating the fold change. Genes were considered regulated if the expression levels differed more than two-fold relative to healing edges. Using GeneSpring, clustering was performed based on similarity of gene expression pattern in all samples.
Primary Fibroblast Cell Culture
Five millimeter biopsies obtained during debridement procedure from three patients were used to establish fibroblast cultures. Biopsies were obtained from two different locations: (A) the nonhealing wound edge and (B) the adjacent nonulcerated skin (Figure 1). Subcutaneous fat was removed, and the tissue was washed six times in PBS, minced into small pieces (approximately 1 mm2 pieces) and placed in 75 cm2 tissue culture flasks containing DMEM (Dulbecco’s modified eagle medium) supplemented with 10% serum and pen/strep/gentamycin. After several days in culture, fibroblasts were observed sprouting out from the tissue explants and once sample cells were obtained, the monolayer was trypsinized to separate the tissue explants from the cells. Dermal fibroblasts were then seeded in the DMEM containing 10% serum and pen/strep/gentamycin mix. Cells were propagated by trypsinization until the fourth passage and used for the wound scratch assay (see below).
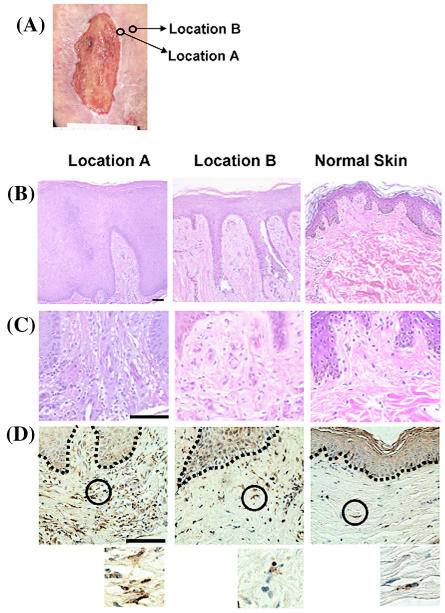
Distinct wound locations have specific histology. (A) A typical venous stasis ulcer is shown. Arrows point to the regions from which biopsies were obtained: A, nonhealing edge and B, adjacent, nonulcerated skin. (B) H&E stained biopsies showing epidermis from nonhealing edge (location A); adjacent, nonulcerated skin (location B); (C) H&E stained biopsies showing dermis from nonhealing edge (location A); adjacent, nonulcerated skin (location B). Normal skin is shown on the right panel. (D) Staining with procollagen shows increased intracellular staining of the nonhealing edge (location A) when compared with adjacent, nonulcerated skin (location B). Circles demarcate the location from which enlarged images are shown (insets below). Normal skin is shown on the right panels. Scale bar: 100 μm
Wound Scratch Assays
Primary human dermal fibroblasts as well as cell cultures derived from patient’s biopsies (see above) were grown to approximately 80% confluency. Twenty-four hours before the experiment, cells were transferred to basal medium containing DMEM with 5% stripped serum (23). To eliminate proliferation, on day 0, cells were treated with 8 μg mL−1 Mitomycin C (ICN) for 1 h, washed with 1×PBS prior to scratch, as previously described (24). Scratches were performed using sterile yellow pipette tips and photographed using a Carl Zeiss microscope and a Sony digital camera (DKC - 500). Cells were further incubated for 4, 8, and 24 h and rephotographed in the same fields as was initially done on day 0. Cell migration was quantified using Sigma Scan Program. Fifteen measurements were taken for each experimental condition and expressed as a percent of distance coverage by cells moving into the scratch wound area for each time point after wounding. Three images were analyzed per condition, per time point, and averages and standard deviations were calculated.
RESULTS
To evaluate skin specimens from specific wound locations, following the debridement procedure, biopsies were obtained from three patients with venous reflux ulcers at two distinct locations: (A) nonhealing edge and (B) the adjacent nonulcerated skin (see Figure 1A) then processed for hematoxylin and eosin staining. The biopsies were obtained in a blinded fashion, that is, the wound location of the biopsy was kept under the code. We found that different locations of nonhealing wounds differ in their morphology. The biopsy obtained from the nonhealing venous ulcer edge (that is, Location A) (Figure 1B) showed thick, hyperproliferative epidermis with hyperkeratotic (hypertrophy of the cornified layer of the skin) and parakeratotic (presence of nuclei in cornified layer) epidermis. Epidermis from the Location B (Figure 1B) was “normalized” and exhibit a well-defined cornified layer and significantly less hyperproliferation as compared with that of Location A. However, it was still thicker than epidermis of normal skin that was not part of the wound (Figure 1B). Epidermal ridges (projections of the epidermis into the dermis) that are present in Location B are artifacts left from the original embedding of the biopsy and sectioning angle. Evidence of fibrosis was also found (Figure 1C). Finally, intracellular procollagen was most pronounced in the dermis from Location A when compared with Location B or unwounded normal skin (Figure 1D). In summary, biopsies from the wound Location A exhibit severe pathogenesis when compared with Location B. We proceed further to identify the transcriptional profile of these biopsies (see below). When we broke the code at the end of these experiments to identify the origin of locations, it was revealed that Location A biopsies were obtained from the nonhealing edge whereas biopsies from Location B were obtained from the adjacent nonulcerated skin. It was evident that following the debridement margin toward the nonulcerated skin, the morphology of the skin biopsies transformed from markedly pathogenic (nonhealing edge, Location A) to normalized (adjacent, nonulcerated Location B). Therefore, we conclude that biology of skin differs within the wound edge and is specific to particular location.
To further characterize the biology of the cells from these specific wound locations, we have established primary dermal fibroblast cultures from two distinct chronic wound locations of each patient. Biopsy from one of the patients failed to produce viable fibroblast culture, and we proceeded with the remaining two sets of primary cells deriving from Location A and B from two different patients. Fibroblasts grown from the nonhealing edge (Location A) exhibit their pathogenic phenotype, whereas fibroblasts derived from the adjacent nonulcerated area (Location B) were very similar to primary fibroblasts obtained from a healthy skin (control) (Figure 2). Fibroblasts from the Location A were misshaped and inflated with enlarged nuclei and clumped together when compared with the normal phenotype. To test their migratory capacity in response to wounding, we performed in vitro wound scratch assays and found a distinct response correlating to each wound location (Figure 3). Specifically, fibroblast grown from the location A (nonhealing edge) have the slowest migration rate, covering only 33% of the initial scratch in 24 h. Fibroblasts from location B (adjacent nonulcerated) covered 75% and were only slightly slower than control, which closed 89% of scratched area (Figure 3). This indicates that there is a direct correlation between specific location within the wound, cellular biology, and cellular response to wounding.
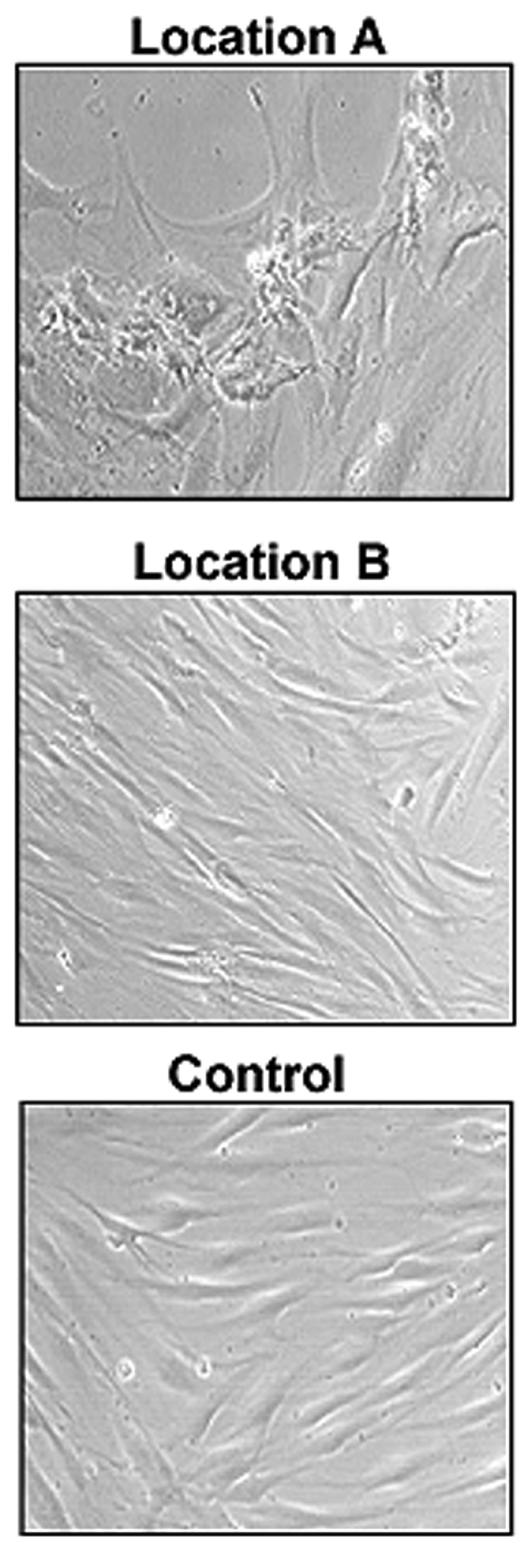
Fibroblasts grown from different wound locations exert specific phenotype. Fibroblasts deriving from Location A (top panel) exhibit characteristic phenotype (misshaped, larger in size, and clumped together). In contrast, fibroblasts deriving from Location B (middle panel) exhibit phenotype similar to normal fibroblasts (bottom panel).
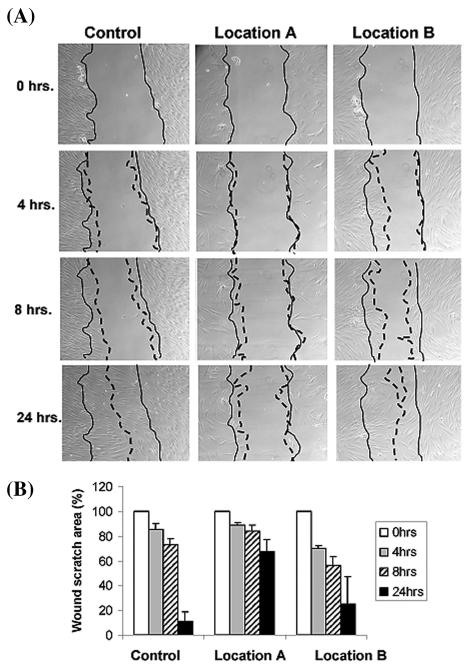
Fibroblasts grown from distinct wound locations have different response to wounding and different migration capacity in the wound scratch essay in vitro. Fibroblasts from Location B migrate similar to normal whereas fibroblasts from the location A have diminished migration capacity. (A) Actual experiment is shown. Full lines indicate initial wound area; dotted lines demarcate migrating front of cells. (B) Histograms indicate the average coverage of scratch wounds widths in % relative to baseline wound width at the 0, 4, 8, and 24 h.
To further characterize the pathology of specific wound locations, we utilized microarray technology. We used Affymetrix HG-U133A chips and performed initial analyses using Gene Spring software to normalize the data. We performed hybridizations of all six biopsies, three from what we considered nonhealing edges (Location A) and three from adjacent nonulcerated skin (Location B). Different samples were compared and a specific transcriptional profile was obtained.
To address the issue of mixed cell populations in our skin samples, we compared mRNA levels of abundantly expressed genes specific for two major cell types: vimentin and perlecan (fibroblasts) and stratifin and junctional plakoglobin (keratinocytes) using microarrays. We chose these four genes because they are expressed at relatively high levels in their specific cell types, and the level of their expression is proportional to the number of their corresponding cell types in the sample. This means that if all cell types are present in similar numbers we expect to see all four genes highly expressed at similar levels. Conversely, if the population of a particular cell type is significantly smaller, the level of expression of the corresponding specific gene will also be smaller compared with others in any given biopsy. Overall, the signal intensity levels, which correlate to the hybridization signal intensity of vimentin, perlecan, stratifin and junctional plakoglobin are a direct measure of the mRNA levels in each of the six biopsies (Table 1). All six biopsies show consistent levels of expression for perlecan, stratifin, and junctional plakoglobin irrespective of the wound location, suggesting that both the keratinocytes and fibroblasts are present at consistent numbers within wound location. Vimentin was regulated between the two locations, but was consistent within each group, again emphasizing consistency in biopsies. Therefore, we conclude that our samples within each location have similar proportions of the two cell types.
Table 1
Cell type specific markers reveal consistent multicellular components of the biopsies
|
Wound biopsy |
Vimentin (VIM) |
Perlecan (HSPG2) |
Stratifin (SFN) |
Junctional plakoglobin (JUP) |
|
Location A |
0.36785 |
0.893798 |
0.50650 |
0.52979 |
|
Location A |
0.39184 |
0.935004 |
0.40537 |
0.55427 |
|
Location A |
0.32949 |
0.690294 |
0.49262 |
0.55113 |
|
Location B |
0.24775 |
0.707999 |
0.44484 |
0.56766 |
|
Location B |
0.23126 |
0.803647 |
0.42237 |
0.53427 |
|
Location Ba |
0.24300 |
0.921853 |
0.47479 |
0.57156 |
Signal intensity normalized to the chip for vimentin, perlecan, stratifin and junctional plakoglobin are shown for each biopsy and particular location. Overall, no considerable changes in the levels of perlecan, stratifin and junctional plakoglobin are found. Vimentin expression is regulated between two locations, but the level of expression is consistent within each group supporting consistent biopsy procedure.
aBiopsy from presumed location B, actual location A, from patient 3 (see Figure 5A).
Gene expression was visualized by generating gene trees, a graphic presentation in which samples are grouped based on the similarity of gene expression profiles (Figure 4). Highly expressed genes are shown as red lines, low expressed genes are represented as green, and yellow indicated intermediately expressed genes. This method allows overall visualization of entire expression pattern rather than focusing on specific gene regulation. Using this approach, we found that regulated genes from all three nonhealing edge biopsies (Location A) showed similar expression pattern. Two out of three samples taken from adjacent, nonulcerated skin (Location B) also exhibit similar gene expression pattern to each other, but their pattern was completely different from the expression pattern obtained from the nonhealing edge. Interestingly, the third sample (asterisk) resembled, remarkably, the profile of the nonhealing edge samples, suggesting that the extent of the debridement did not reach the Location B. When we analyzed histology from these two biopsies, we found that Location A is consistent with characteristics of the nonhealing edge, whereas the histology of the incomplete Location B also shows hyper-and parakeratosis but not as prominent (Figure 5B). Thus, the gene expression pattern parallels histology. This data suggests that gene expression pattern changes may serve as an indication of the pathogenic progress within the wound, which can further guide the extent of the debridement. Therefore, we conclude that the specific tissue morphology coupled with particular gene expression profile indicates that cell from these two wound locations exhibit different biological features.
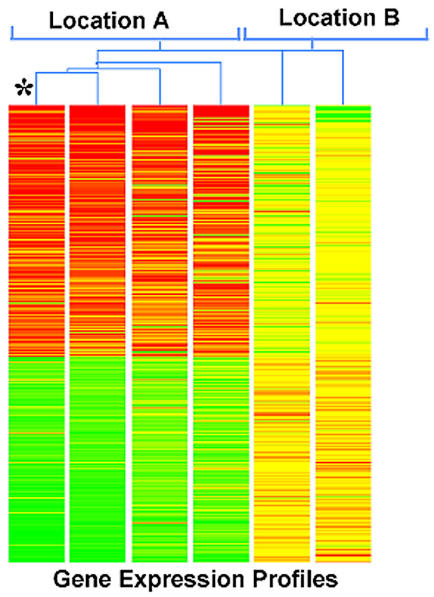
Distinct wound locations have specific recognizable gene expression pattern. Gene tree (a graphic presentation in which samples are grouped based on the similarity of gene expression profiles) showing different gene expression patterns between two different wound locations: Location A, nonhealing edges (left) and adjacent, nonulcerated area, Location B (right). Highly expressed genes are shown as red lines, low expressed genes are represented as green, whereas yellow color indicated intermediately expressed genes. Asterisk marks the biopsy originating from what presumably was Location B, but based on expression pattern reveals the Location A specific profile.
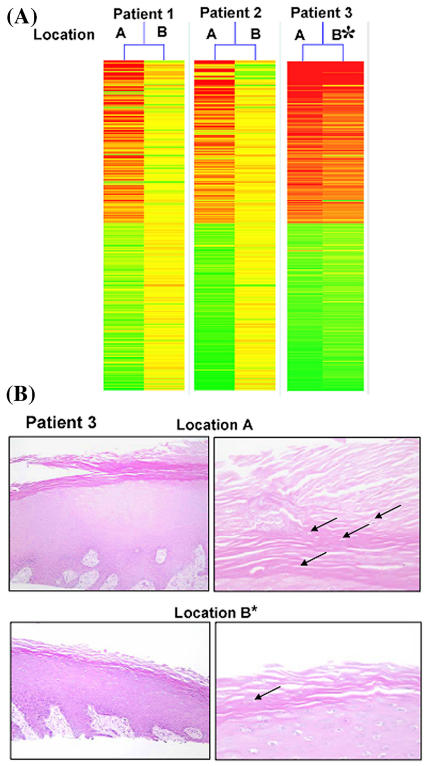
Histology analyses of incompletely derided location confirm its gene expression pattern. (A) Gene tree indicates incomplete debridement of patient 3 (*). (B) H&E staining of Location A (top panels) and Location B* (bottom panels) from Patient 3 are shown. Stratum corneum remains hyper and parakeratotic in Location B* although less prominently. Arrows point to nuclei present in cornified layer.
To identify specific changes in gene expression between the two wound locations we have focused on the top twenty genes (top ten induced and top ten repressed) with the most differential expression between the two locations. The gene list shown in Table 2 represents genes that are either induced or suppressed in Location A when compared with Location B. Immediately noticeable are the two most regulated genes: KRT2A (suppressed –18.98 fold) and SPRR3 (induced 122.95 fold). Both of these genes participate in the same cellular process, epidermal differentiation, indicating its deregulation (25). We found induction of keratins KRT17 and K6HF indicating keratinocyte activation (26). In addition, we found that genes participating in DNA synthesis are induced (UPP1 and RPM2), signifying induced cell cycling. In addition, we also found MMP1 among strongly induced genes, which is expected and serves as a control of the experiments (27). We found KLK2, IGFBP2, and CEACAM6 to be induced in Location A. High expression levels of these genes have been linked to carcinogenesis (28,29). Among suppressed genes, in addition to KRT2A, we also found another gene participating in epidermal differentiation SPRL1B. In addition, we found that Lactoferrin gene (LTF), which is known to promote wound healing (30), is suppressed in Location A. Furthermore, a group of genes related to melanogenesis (Tyrosinase-related protein 1, TYRP1; Dopachrome tautomerase, DCT 1; Silver homolog SILV and melanocytic marker MLANA) are found suppressed indicating possible cross-talk between keratinocytes and melanocytes (31).
Table 2
Gene expression profiles of skin biopsies deriving from Location A are compared with those deriving from Location B
|
Probe Set |
Signal intensity Location A |
Signal intensity Location B |
Fold change A/B |
Gene symbol |
Biological process |
|
207908_at |
0.1911278 |
3.6270018 |
−18.98 |
KRT2A |
Cytoskeletal, keratin |
|
205694_at |
0.4964355 |
7.170005 |
−14.44 |
TYRP1 |
Melanogenesis |
|
205338_s_at |
0.5581124 |
7.713765 |
−13.82 |
DCT |
Melanogenesis |
|
205969_at |
0.8425417 |
10.757287 |
−12.77 |
AADAC |
Metabolism |
|
207710_at |
0.2809552 |
3.5683882 |
−12.70 |
SPRL1B |
Epidermal Differentiation |
|
202018_s_at |
0.615926 |
7.8120275 |
−12.68 |
LTF |
Metabolism |
|
206427_s_at |
0.4980113 |
5.6414332 |
−11.33 |
MLANA |
Membrane protein |
|
214624_at |
0.3403361 |
3.7057745 |
−10.89 |
UPK1A |
Cytoskeletal, membrane |
|
209848_s_at |
0.565165 |
5.337092 |
−9.44 |
SILV |
Tumor antigen |
|
206149_at |
0.5969547 |
5.2890344 |
−8.86 |
LOC63928 |
Tumor antigen |
|
218990_s_at |
1.5810227 |
0.0128595 |
122.95 |
SPRR3 |
Epidermal Differentiation |
|
220782_x_at |
1.3217627 |
0.0590565 |
22.38 |
KLK12 |
Proteolysis, extracellular |
|
203757_s_at |
1.5295707 |
0.0912303 |
16.77 |
CEACAM6 |
Adhesion, junctional |
|
204475_at |
1.58655483 |
0.0989461 |
16.03 |
MMP1 |
Proteolysis, extracellular |
|
205157_s_at |
1.117604 |
0.0728645 |
15.34 |
KRT17 |
Cytoskeletal, keratin |
|
202718_at |
1.8873352 |
0.1456776 |
12.96 |
IGFBP2 |
Secreted |
|
207065_at |
1.6435777 |
0.1307626 |
12.57 |
K6HF |
Cytoskeletal, keratin |
|
203234_at |
1.2837839 |
0.1064886 |
12.06 |
UPP1 |
DNA repair, synthesis |
|
37892_at |
1.571357 |
0.1323801 |
11.87 |
COL11A1 |
ECM |
|
209773_s_at |
1.165621 |
0.1017562 |
11.46 |
RRM2 |
DNA repair, synthesis |
Top ten induced and top ten suppressed genes are shown.
Finally, we found Uroplakin 1 (UPL1) to be suppressed in the Location A, possibly indicating change in permeability and the loss of epithelial flexibility (32).
To further evaluate the microarray data, we focused on epidermal growth factor receptor, EGFR. Using EGFR specific antibody, we stained sections from Location A and Location B as well as normal skin (Figure 6). We found noticeably different pattern between the two locations. We found a marked reduction of EGFR in epidermis of the nonhealing edge, Location A as well as primarily cytoplasmic localization. In contrast, EGR was abundantly present in the Location B. It localized to the membrane and also showed cytoplasmic presence. As expected, EGFR was only membranous in the epidermis of control skin.
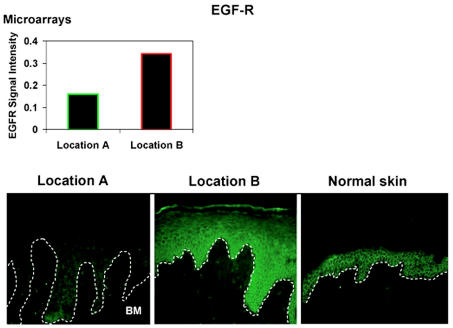
EGFR expression pattern indicate differential expression between two wound locations. EGFR is membranous in control, unwounded skin. Its expression is markedly reduced and cytoplasmic in Location A. It is more prominent in the Location B resuming membranous pattern of expression. BM = basement membrane.
Taken together, our data identified a distinct subpopulation of cells within the wound and revealed that cells at specific locations differ in their ability to respond to wounding and its stimuli, thus indicating the importance of targeted debridement. Furthermore, we have shown that gene expression pattern correlates with wound locations and cellular responses and may be utilized as a guiding tool for surgical debridement.
DISCUSSION
In this report, we have identified a method utilizing gene expression profiling that distinguish the area of surgical debridement in a chronic wound (for example, venous ulcer). Histologic analyses demonstrated that the nonhealing edge has a hyperkeratotic epidermis, absent in the adjacent nonwounded skin as well as increased fibrosis in the non-healing edge as compared with the nonwounded skin.
The expression profile has a biological correlation to fibroblast cell migration capacity. We found that gene expression profiles of specific regions in a chronic wound manifest a transcriptional profile that does not necessitate data mining (typical for microarrays) but can be easily interpreted by creating a simple color pattern, gene tree. Cells grown from the biopsies obtained from the nonhealing edge showed diminished capacity to migrate or respond to wounding, whereas the cells derived from the adjacent, nonulcerated area of the wound showed increased capacity to migrate when compared with cells from nonhealing edges and responded well to the wound-healing stimuli. In summary, we have shown that by generating the gene expression profiles of the specific wound region, one can quickly identify which region of the wound the biopsy originates from and how well the wound was debrided.
We have shown that the edge of surgical debridement (adjacent nonulcerated area, Location B) is distinct from non-healing edge and is responsive to wounding. Therefore, we propose that in the future, similarly, to Mohs microscopic surgery (33) where conventional hematoxylin & eosin staining is used to determine the presence of residual tumor cells in tissue around the clinical margins of the lesion, microarray profiling can be used to determine the margin of debridement within the chronic ulcer.
All these findings are consistent with the histology findings of hyperproliferative and hyperkeratotic epidermis reflecting inability of keratinocytes to properly execute either of the two processes: activation or differentiation. This is further supported by the analyses of regulated genes (see Table 2). Genes participating in the process of epidermal differentiation are found both strongly induced and suppressed in Location A, suggesting deregulation of this process, which is consistent with hyper- and parakeratotic epidermis. Furthermore, genes participating in DNA synthesis and keratinocyte activation are induced, indicating activation of keratinocyte proliferation.
Why is proper debridement of chronic ulcer important for the clinical outcome? It has been shown that sharp debridement increases healing rate of chronic ulcers when compared with healing rate of nondebrided wounds. Between weeks 8 and 20 post-debridement, 16% of debrided ulcers compared with 4.3% of control ulcers achieved complete healing (4,34). Based on the data presented in this paper, coupled with clinical observations, we believe that the aim of debridement is not only to remove the necrotic tissue but also to approach and expose the cells within the wound that are biologically capable of responding to wound-healing stimuli. It is also important to note that the cells originating from the biopsies of the adjacent nonulcerated area of the wound (Location B) are distinct from the wound as this location is physiologically impaired, i.e. underlying venous reflux (35,36) and fibrosis (Figure 1C). This would further suggest that perhaps the time of healing could be reduced if appropriate, more responsive cells are exposed to wound-healing signals. This is further reinforced by our findings of differential expression pattern of EGFR between two locations. Our data demonstrate that not only is EGFR suppressed in the keratinocytes of the non-healing edge but it is also predominantly cytoplasmic. This would indicate that the keratinocyte at the nonhealing edge have diminished ability to respond to EGF, as the EGFR is not in place to transmit the signal. In contrast, keratinocytes after the debridement, Location B, have normalized expression pattern of EGFR. There is an increase of its overall presence and its localization is membranous as well as cytoplasmic. Although, Location B does not exhibit a completely restored normal epidermal pattern, it is evident that these cells have better ability to respond to EGF when compared with Location A.
Here we showed that gene expression map differs in particular wound locations. We also show that these differences do not originate from a variation in major cell types (keratinocytes and fibroblasts) in biopsies. Although keratin genes are the most utilized markers of keratinocytes (37), we found them to be transcriptionally regulated and, therefore, could not be used as cell type markers. Thus, we have chosen two other specific genes that show no transcriptional regulation (stratifin and junctional plakoglobin) (38,39) to demonstrate the relative presence of keratinocytes in the patients’ samples.
Our findings also indicate that even without complex microarray data mining (analyses of which specific genes are differentially expressed) between the two locations one can determine the origin of the biopsy. Therefore, transcriptional maps obtained during the debridement may be used as a “guiding tool” to determine the debridement margin. This is exemplified in the biopsies from Patient 3 (please see Figure 5A). The pattern of the Location A biopsy is similar for all three patients, suggesting similar gene expression profile for this location. Location B pattern is similar for patients 1 and 2 biopsies. However, the pattern of the Location B for Patient 3 shows high similarity to Location A indicating that further debridement would be required to reach the appropriate cells of the Location B. Once the pattern shows high similarity to Location B, the debridement would be considered sufficient. Presently, microarray type of analyses is expensive and time consuming. Processing the tissue samples, from obtaining the biopsy to obtaining the transcriptional “bar code” takes approximately three days. Even under current treatment protocols, it would be clinically very useful to obtain the information if the wound was debrided sufficiently. For example, in some cases, there is a waiting period from the day of debridement until granulation tissue forms and the wound bed is prepared for application of the tissue engineering products. We emphasize that this is an initial report and much future work is needed to accomplish the standardization of this assay to achieve its applicability at the bedside.
The patient is often blamed for non-compliance (that is, they did not elevate the leg sufficiently in bed) when standard compression therapy fails after debridement. These are not evidence-based practices that may have debilitating outcomes. Alternatively, our data suggest that utilization of molecular tools provide the ability to inform a patient when healing is expected based on the molecular pattern of the wound or if further debridement is necessary. Furthermore, this approach provided a guidance for debridement identifying cells responsive to wound-healing stimuli that may increase the potency of applied standard of care for venous ulcers and cellular therapy or growth factor applications (6,7).
In the future, we propose that technological development will allow rapid processing of the RNA from tissue to the chips. Recently, a desktop machine, which will allow physicians to assess patients DNA from a single drop of blood in just an hour, has been reported, bringing a completely new outlook for personalized medicine (40). Similarly, recent scientific developments coupled with technological advances in the area of cancer research also bring the promise of more personalized cancer treatment (41). Therefore, transcriptional maps obtained using microarrays can serve as a guide for a surgical debridement, which will enhance the therapeutic potential, an important step in healing chronic ulcers.
Acknowledgments
Special thanks to Dr H. Paul Ehrlich, Dr Stephen Dotty, and members of HSS histology core for their assistance in histology analyses. Our research is supported by the National Institutes of Health grants DK59424 (HB), LM008443 (HB), AR45974 (MT-C), NR08029 (MT-C), and the VCU A D Williams Foundation (RFD). We also acknowledge the use of The Musculoskeletal Repair and Regeneration Core Center of HSS (AR046121).
Footnotes
Online address: http://www.molmed.org
